
Force Plate Testing: What It Measures and How to Use the Data
September 9, 2026
11 min. read
A jump may look powerful to the eye, yet two people who reach the same height can produce that result in very different ways. One may generate force quickly and leave the ground with a short movement time. Another may use a deeper countermovement and take longer to produce the same outcome. Those differences can be difficult to see without objective measurement.
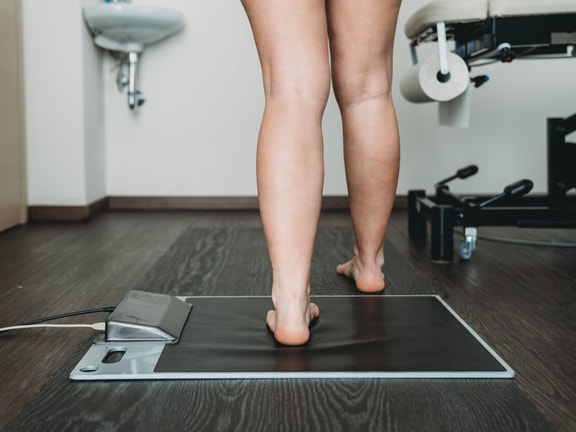
Force plate testing captures the forces a person applies to the ground during movements such as jumping, landing, standing, and isometric strength tasks. Instead of recording the final outcome alone, force plates can show how that outcome was produced.
Force Plate Testing Cheat Sheet
Submit a few brief details to unlock your free Force Plate Testing Cheat Sheet download!
That distinction makes force plate testing useful for tracking performance, identifying changes in movement strategy, comparing limbs, and following progress during rehabilitation. At the same time, the growing number of available metrics can make force plate reports difficult to interpret.
The sections below cover what force plates measure, which metrics matter, and how testing conditions affect the results. That context turns a large dataset into information that supports better programming decisions.
What is force plate testing?
Force plate testing uses a platform containing sensors that measure the force applied against the ground. Most sport and rehabilitation applications focus on vertical ground reaction force, although laboratory systems may measure forces across multiple directions.
As someone stands or moves on the plate, the system records force continuously over time. From this force-time signal, software can calculate variables related to strength, power, impulse, movement time, balance, and other aspects of physical performance.
Force plates are commonly used for tests such as:
● Countermovement jumps
● Squat jumps
● Drop jumps
● Single-leg jumps and landings
● Isometric mid-thigh pulls
● Isometric squat testing
● Single-leg or double-leg balance tests
During balance testing, force plates can also calculate center-of-pressure measurements. Force platforms are widely regarded as a reference technology for measuring center-of-pressure variables used in postural balance assessment.¹
The countermovement jump is one of the most widely used force plate assessments because it provides information about several phases of movement from a short, repeatable task.
A force-time curve from a countermovement jump can generally be divided into weighing, unweighting, braking, propulsion, flight, and landing phases.² Looking at these phases separately can reveal changes that jump height alone may miss.
For example, an unchanged jump height does not necessarily indicate stable performance. A person might achieve the same height while taking more time to produce force or using a deeper countermovement.
What does force plate testing measure?
Modern force plate systems may produce dozens of metrics from a single test. More data does not automatically produce more useful information. The metrics selected should relate to the purpose of the assessment.
Several categories are especially common:
Jump height
Jump height provides a straightforward measure of jump performance and is often the first metric reviewed after a countermovement jump.
Force plates can estimate jump height using methods based on flight time, takeoff velocity, impulse, or displacement. These calculation methods are not interchangeable. Research comparing force-platform calculations has found that different equations can produce meaningfully different jump-height values.³
For longitudinal testing, using the same hardware, software, calculation method, and testing protocol makes comparisons more meaningful.
Force
Ground reaction force represents the force applied against the ground.
Force-related metrics may include:
● Peak force
● Mean braking force
● Mean propulsion force
● Relative force normalized to body mass
Peak force can be useful, but it captures only the highest force recorded during a brief instant. Mean force during a defined movement phase may provide more context about how force was applied across the movement.
Which force metric to prioritize depends on the question being asked.
Impulse
Impulse accounts for both force and the amount of time over which that force is applied.
In a countermovement jump, propulsive impulse contributes directly to the change in velocity needed for takeoff. Two people can produce similar peak forces yet create different impulses because one maintains force for a longer period.
Impulse may therefore provide information that peak force alone cannot.
Device consistency matters when interpreting these measurements. A 2025 study comparing clinical-grade and laboratory-grade force plates found good agreement for jump height, peak ground reaction force, and eccentric rate of force development, while several impulse measurements showed poorer agreement between systems.⁴
Rate of force development
Rate of force development (RFD) describes how quickly force increases.
Many sport movements provide little time to generate force. Peak force may describe how much force a person can eventually produce, while RFD provides information about how quickly that force becomes available.
RFD can be calculated across different time intervals or movement phases, so reports should identify how the metric was calculated before values are compared.
Older reliability research on countermovement jump testing found strong within-session reliability for several force, power, and velocity measurements, while peak RFD was less reliable.⁵ For this reason, changes in RFD should be interpreted alongside measurement variability and other performance measures rather than from a single value.
Medbridge offers strength and conditioning education covering concepts related to strength, power, programming, and performance development.
Limb asymmetry
Dual force plates allow each leg to be measured separately during bilateral tasks.
This can identify differences in how force is distributed between limbs during jumping, landing, or isometric testing. A person can produce an acceptable total jump height while shifting more of the workload toward one side.
Asymmetry gets the most attention during rehabilitation.
Research following anterior cruciate ligament reconstruction has reported persistent differences in loading between limbs, supporting the use of measures such as vertical ground reaction force alongside other return-to-sport assessments.⁶
Still, asymmetry does not automatically indicate injury risk. Natural side-to-side differences occur, and the limb producing the greater value can change depending on the movement being tested. Reviews of asymmetry testing have cautioned against treating a single threshold as a universal marker of readiness or injury susceptibility.⁷
The more useful question is often how a person's current asymmetry compares with previous testing and with other measures of strength, function, symptoms, and movement.
How force plate testing can guide training and rehabilitation
The value of force plate testing comes from repeated measurement rather than a single test performed in isolation.
A baseline can provide a reference point. Later testing can then show how force production and movement strategy change following training, fatigue, injury, or rehabilitation.
For performance monitoring, a countermovement jump might show that jump height remains stable while movement time increases. Another testing session might show lower jump height accompanied by reductions in propulsive impulse. Those patterns point to different underlying changes, and the first would go unnoticed in a report that tracked jump height alone.
Force plate data can also help guide exercise selection.
A person who produces substantial force but requires a long time to do so may have different training needs than someone who produces force quickly but lacks maximal force capacity. Force plate results can therefore complement strength testing, training history, sport demands, and observed movement when building a program.
During rehabilitation, testing can provide another layer of information about how an injured limb is being loaded.
A 2026 scoping review of force plate jump testing after ACL reconstruction found considerable variation in the clearance criteria used across studies. Time from surgery was the most frequently reported criterion, while limb symmetry indexes were used less consistently.⁸ These findings support treating force plate results as one part of a broader readiness assessment rather than a single clearance test.
How to get more useful results from force plate testing
Standardization is one of the most important parts of force plate testing.
Small changes in the test can change the result. Countermovement depth, arm position, instructions, footwear, warm-up, fatigue, and rest between trials can all affect performance.
For repeated countermovement jump testing, a protocol might specify:
● The same warm-up
● Hands fixed at the hips
● Self-selected countermovement depth
● A consistent number of practice and recorded trials
● The same rest period between jumps
● The same force plates and software
● Testing at a similar point relative to training
Instructions matter as well. Asking someone to “jump as high as possible” may produce a different strategy than asking for a jump that is both high and fast.
Research has shown that countermovement depth and velocity can influence force-time measurements, which makes changes in movement strategy important when interpreting longitudinal data.⁹
It also helps to decide which metrics will be reviewed before collecting large amounts of data. A small group of repeatable measurements tied to a clear question is usually more useful than scanning dozens of values after each test.
Force plate testing example
Consider someone returning to jumping activities after a lower-extremity injury.
Propulsion contribution describes how much each leg contributes to the total force or impulse used to push the body upward during the propulsive phase of a jump. With dual force plates, the contribution from the left and right legs can be calculated separately. A 50/50 split indicates equal contribution between limbs, while a 58/42 split means the left leg is contributing more to propulsion than the right. These values should be interpreted alongside other measures rather than treated as a standalone marker of readiness or impairment.
During the first testing session, a countermovement jump produces:
● Jump height: 30 cm
● Left-leg propulsion contribution: 58%
● Right-leg propulsion contribution: 42%
Six weeks later:
● Jump height: 32 cm
● Left-leg propulsion contribution: 52%
● Right-leg propulsion contribution: 48%
Looking at jump height alone, performance increased by 2 cm.
But the force plate data captures more than that. The second test shows both a modest improvement in jump performance and a more balanced distribution of propulsion between the limbs.
That does not mean a 48/52 split automatically establishes readiness for unrestricted activity. Strength testing, symptoms, movement quality, confidence, exposure to sport-specific demands, and other measures still matter.
The force plate provides objective evidence that can be considered alongside the rest of the assessment.
That is the main value of force plate testing. The technology can measure far more than how high someone jumps or how much force someone produces. It can show how force develops over time, how load is distributed between limbs, and how movement strategies change across repeated assessments.
Used with a standardized protocol and a focused set of metrics, force plate data can provide a clearer picture of physical performance and rehabilitation progress without relying on any single number to make the decision.
References
Baker N, Gough C, Gordon S. Classification of balance assessment technology: A scoping review of systematic reviews. Studies in Health Technology and Informatics. 2020. https://pubmed.ncbi.nlm.nih.gov/32141878/
Mao C, et al. The validity of a dual-force plate for assessing counter-movement jump performance. Sensors. 2024. https://pmc.ncbi.nlm.nih.gov/articles/PMC11397850/
Eythorsdottir I, et al. The battle of the equations: A systematic review of jump height calculations using force platforms. Sports Medicine. 2024. https://link.springer.com/article/10.1007/s40279-024-02098-x
Greenberg E, et al. Agreement of clinical grade and laboratory grade force plates for countermovement jump metrics in youth athletes. International Journal of Sports Physical Therapy. 2025. https://pmc.ncbi.nlm.nih.gov/articles/PMC12673951/
Hori N, et al. Reliability of performance measurements derived from ground reaction force data during countermovement jump and the influence of sampling frequency. Journal of Strength and Conditioning Research. 2009. https://pubmed.ncbi.nlm.nih.gov/19387390/
Hughes G, et al. Lower limb asymmetry after anterior cruciate ligament reconstruction in adolescent athletes: A systematic review and meta-analysis. Journal of Athletic Training. 2020. https://pmc.ncbi.nlm.nih.gov/articles/PMC7462171/
Bishop C. Interlimb asymmetries: Are thresholds a usable concept? Strength and Conditioning Journal. 2021;43(1):32-36. https://doi.org/10.1519/SSC.0000000000000554
Christoffel L, et al. Clearance criteria for determining eligibility for force plate testing after anterior cruciate ligament reconstruction: A scoping review. Medicina. 2026. https://pubmed.ncbi.nlm.nih.gov/41901584/
Pérez-Castilla A, Rojas FJ, Gómez-Martínez F, García-Ramos A. Vertical jump performance is affected by the velocity and depth of the countermovement. Sports Biomechanics. 2021;20(8):1015-1030. https://pubmed.ncbi.nlm.nih.gov/31359825/
Meet the Authors


Subscribe to Our Newsletter
Related Posts

September 3, 2026
Rate of Force Development: How It’s Measured and Improved
By Kandis Daroski and Medbridge
March 30, 2016
Shoulder Biomechanics and Exercises
By Robert Donatelli

May 29, 2019
Muscle Performance Testing: Create Your Own Dynamometer
By Jared Vagy and Joseph Derian
January 22, 2020
Moving Beyond MMT: Diagnosing & Treating Movement Dysfunction
By Jared Vagy and Tatiana Brovko Gray PT