PDGM: Lessons Learned

After twenty years in the Prospective Payment System (PPS), the home health industry was moved to the Patient Driven Groupings Model (PDGM) on January 1, 2020.
No one could have predicted what would occur just a few months later to change the way the world functioned. All aspects of healthcare were impacted by the pandemic in ways that are still unfolding to this day.
Medicare’s annual update to home health regulations for 2021 was minimal as agencies juggled waivers, telehealth, and workforce issues—but even though some agencies felt that there was a degree of laxity in the midst of the crisis, Medicare did continue collecting OASIS and claims information during the pandemic.
A Change in Agency Behavior?
The proposed rule for 2022 was released in July 2021. It’s now clear that Medicare had not just collected data but had also analyzed it to assess actual versus expected performance in PDGM.
Looking at several of the data tables in the proposed rule, one can see the lack of alignment between the data collected in 2020 and that from 2018 and 2019 with respect to coding, functional assessment, and utilization patterns.
Medicare did not recommend significant changes to PDGM based on the data analysis, but the inclusion of this information means we could see them down the line. Home health agencies need to take a look at their own data to assess any potential risk areas and ensure processes related to coding, OASIS, and clinical decision making are being driven by the individual presentation of the patient and not the payment pillars of PDGM.
Here are a few of the data tables that reflect the reality of 2020 compared with what was anticipated. Note that Medicare’s “simulated” data for 2018 and 2019 is not just a guess but came from actual diagnosis coding, functional assessment, and utilization patterns.
ICD-10 Coding—Clinical Grouping
The higher-than-expected percentage of Medication Management, Teaching, and Assessment (MMTA)—Respiratory could be explained by the nature of the pandemic, but that does not explain the significant drop in MMTA—Endocrine.
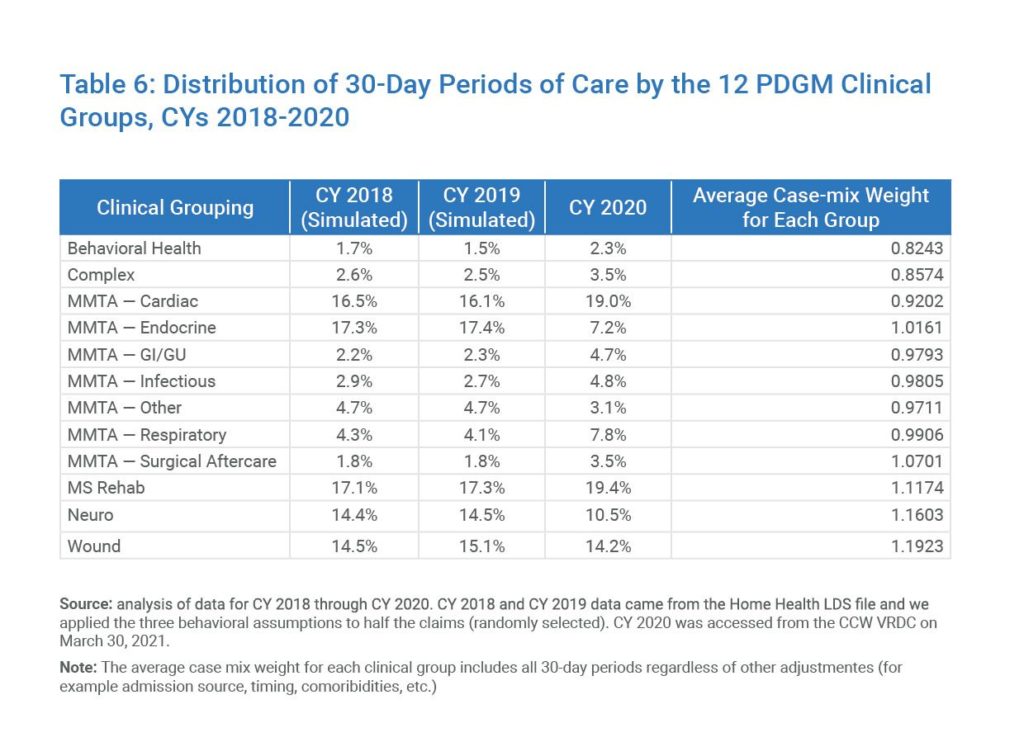
Table 6: Distribution of 30-Day Periods of Care by the 12 PDGM Clinical Groups, CYs 2018-2020
ICD-10 Coding—Comorbidity Adjustment
Knowing that the “high” comorbidity adjustment directly relates to a higher level of payment, the shift seen away from “none” and “low” can raise eyebrows about what may have motivated it.
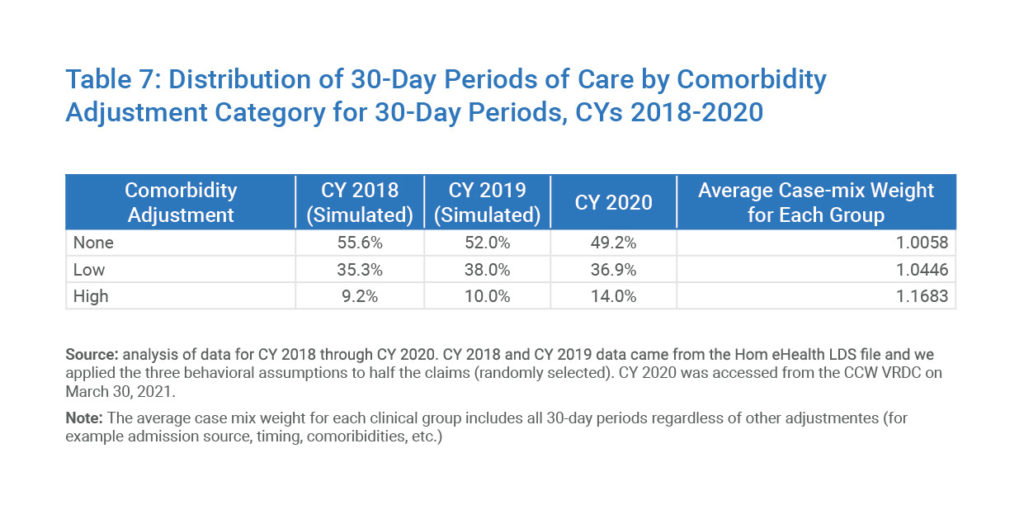
Table 7: Distribution of 30-Day Periods of Care by Comorbidity Adjustment Category for 30-Day Periods, CYs 2018-2020
Functional Impairment Level
Just like the comorbidity adjustment, the higher-paying “high” functional impairment level well exceeds the previous levels seen in the 2018 and 2019 data.
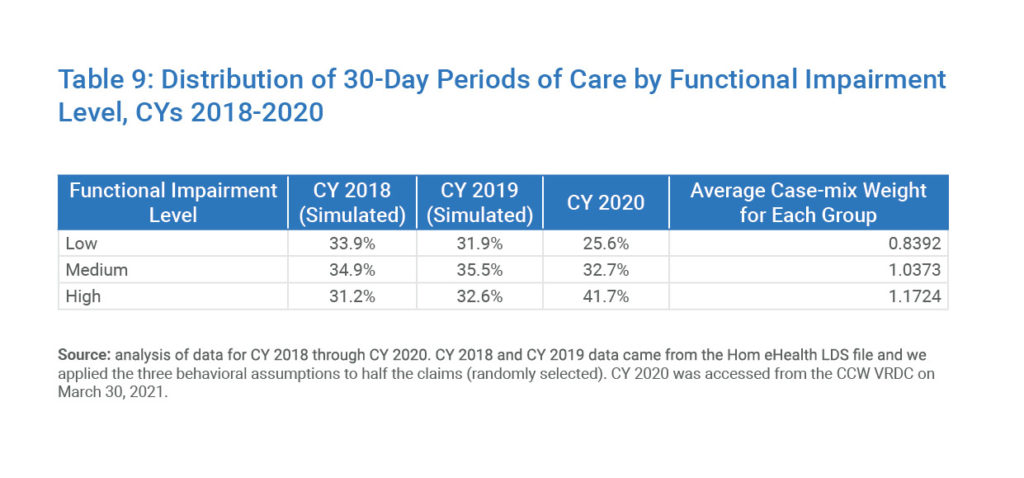
Table 9: Distribution of 30-Day Periods of Care by Functional Impairment Level, CYs 2018-2020
Utilization
Movement to 30-day payment periods and the end of the payment adjustment specific to the number of therapy visits in PDGM did NOT change what Medicare beneficiaries can receive under the Part A Home Health benefit. The drops in all three therapies—especially when combined with a higher level of “high” functional impairment—raises concerns about what is driving utilization decisions. It is clear that the pandemic played a significant role in lower than expected utilization across all services but when combined with the coding and OASIS data, it gives the impression that agencies changed behavior when PDGM became reality.
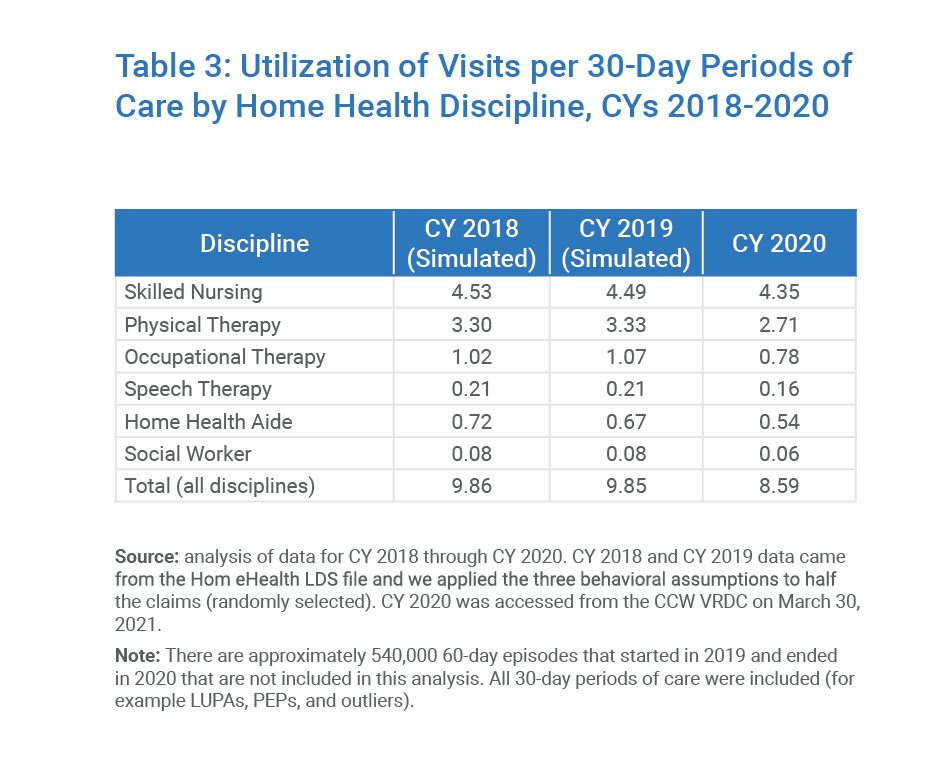
Table 3: Utilization of Visits per 30-Day Periods of Care by Home Health Discipline, CYs 2018-2020
Looking Ahead
PDGM offers both risks and opportunities for home health agencies. For a deeper dive into what agencies need to be monitoring in light of the data presented in Medicare’s proposed rule for 2022, join us for our new live webinar, PDGM: Lessons Learned and Looking Ahead on October 28th, 2021.